Exploring PortML’s dataset analysis
Analyzing a dataset before running machine learning algorithms on it should be common practice for every data scientists. However, more often than not people skip over this important step as it can be time consuming. PortML makes data analysis easy by automatically providing insights into your datasets. In this blog, we will use the well known iris dataset to explore PortML’s automated data analysis.
Feature selection
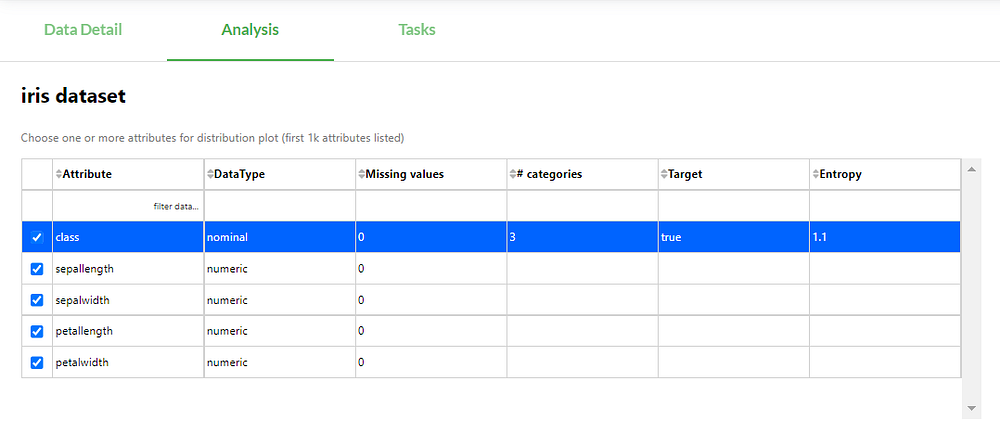
Search for a dataset on the PortML platform and go to the ‘analysis’ tab. First thing you find is an overview of the features in the dataset. You can select which features you want to include in the analysis. The iris dataset only contains 4 features and 1 target feature, so let’s go ahead and select all 5. Notice that the table already gives some first insights on missing values, number of categories for nominal data and entropy.
Feature distribution
The distribution of the data is probably the most simple, but most intuitive way to get some insights in your data. You can easily see if the features overlap or are more easily separable. It can also be useful to spot outliers or see if some features needs to be rescaled. But first, let’s look at the distribution of the three target classes:
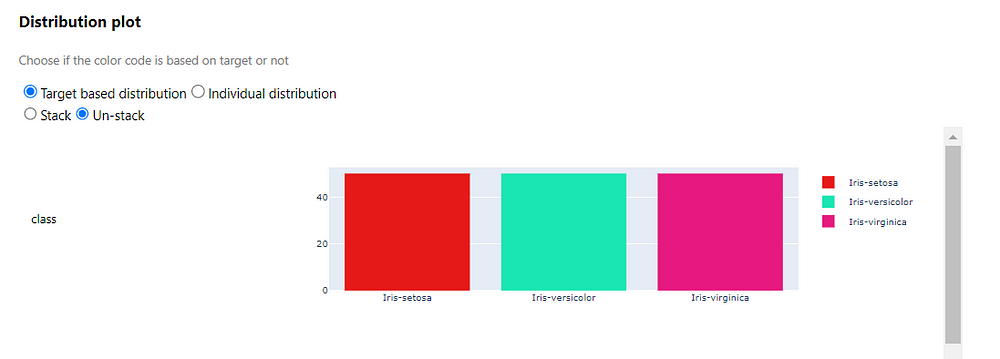
The distribution among the target classes can be quite important. For example if one target class occurs only a few times and another class dominates the data, this can lead to crooked models which can only accurately predict one of the classes. Luckily, the iris dataset is perfectly balanced.
Now let us look at the distribution plots of iris’ other features:
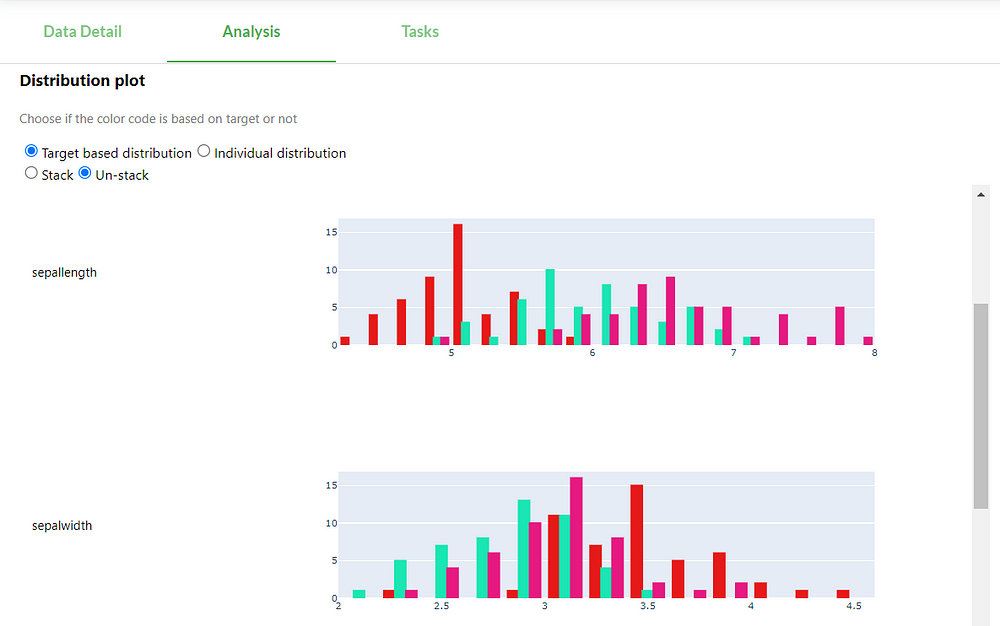
For the sepal features, we do not see any outliers and the features value have roughly the same scale, looks good! However, the distributions of these features overlap quite a lot, so it should be difficult to get an accuracy near 1. But these were only the sepal features, let’s look at the petal distributions:
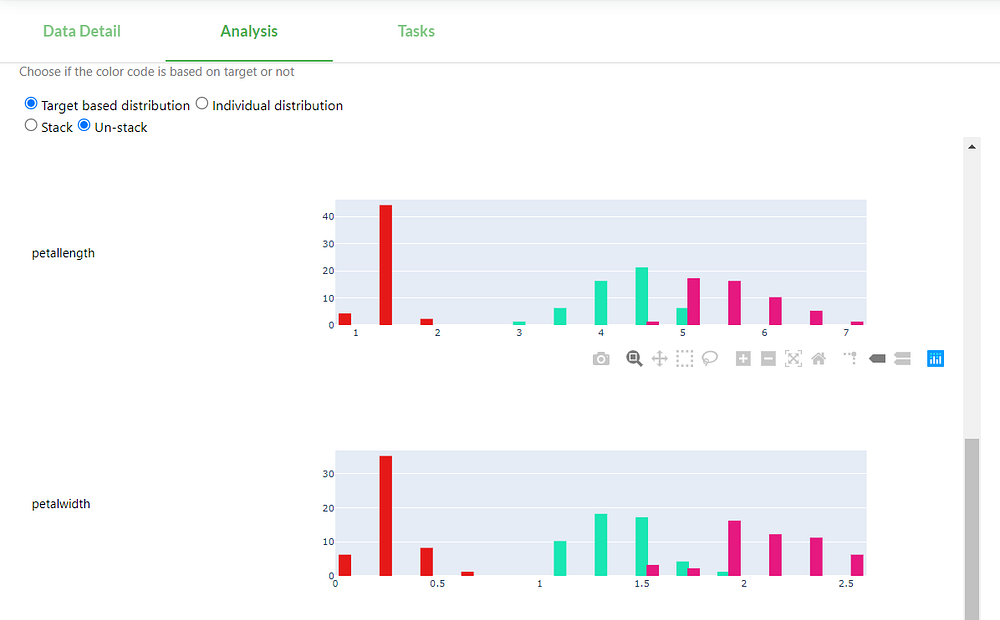
Interesting! The setosa class can be perfectly linearly separated from the other two classes based on only the petal features. We can guess that the algorithms will give a higher weight to the petal features.
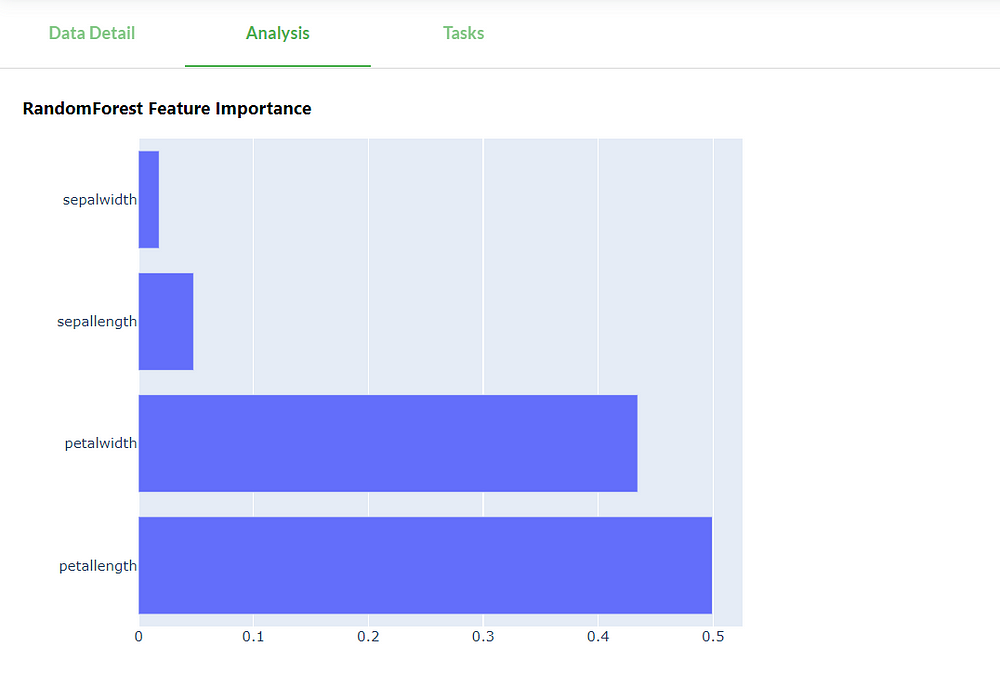
Feature importance
The analysis also shows the importance of each feature based on a random forest. The petal features score a lot higher than the sepal features. We can see that it agrees with our hypothesis we made from the distribution plots!
Feature correlation
Lastly, the analysis provides a scatter plot for each combination of features.
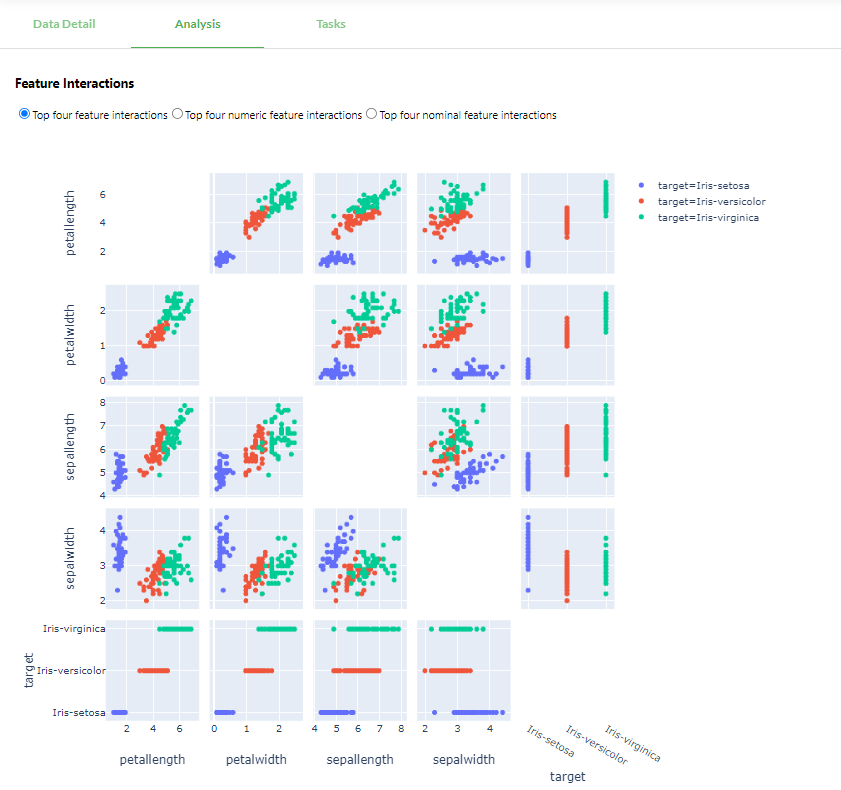
With so many plots it is easy to get lost. But what’s important? We want to see if there is any correlation between features. For example, petalwidth and petallength are highly positively correlated as they lie almost on a diagonal line. This could be a reason to leave one of the features out, which is especially valuable when your datasets has too many features. Another example is the combination sepallength and sepalwidth. There hardly appears to be any correlation between the two, making them important to include in used features.
Conclusion
Visual data analysis is a useful tool to quickly get some first insights into your dataset. You can spot outliers, trends, scaling issues and make intelligent decisions on what features are important to include when training. This commonly time consuming task is automated by PortML. By providing feature distributions, importance and correlation plots, we were able to easily get useful insights into the iris dataset.
Check it out on OpenML!
PortML brings the power of the open platform OpenML to a secured, private environment. You can check out the iris dataset analysis yourself at https://www.openml.org/d/61/.